Summer@ICERM 2020: Graph Spectral Clustering
|
Max Daniels Northeastern Univeristy daniels.g@northeastern.edu |
Catherine Huang University of California, Berkeley thecatherinehuang@berkeley.edu |
Shubham Makharia Brown University shubham@brown.edu |
Chloe Makdad Butler University cmakdad@butler.edu |
Welcome to the project page for our Summer@ICERM 2020 project!
We study the Graph Spectral Clustering algorithm, an alternative to Euclidean clustering algorithms like K-Means, which is geometrically motivated for use on data with few intrinsic factors of variation. It is often challenging to cluster this type of data because one must determine which features are meaningful and which are not. A useful rule of thumb is that in high dimensional settings, only local Euclidean distances are meaningful.
Spectral clustering takes this into account by operating on a similarity graph derived from the data. Edges in the graph represent data similarity and are typically computed with a kernel function like RBF or the exponential kernel. After obtaining the similarity graph, Graph Spectral Clustering utilizes a derived matrix, the Graph Laplacian to find cluster assignments.
In this work, we study the role of the Graph Laplacian and connect Graph Spectral Clustering to the behavior of heat diffusion, which is governed by a second order PDE involving the Laplacian operator. For more information, please see our report!
We thank our project supervisors, Akil Narayan and Minah Oh, as well as our graduate TA supervisors, Alex Mihai and Liu Yang. We also thank our peers at ICERM for useful discussion, and all of the ICERM organizers for a hosting a wonderful program.
Demonstrations
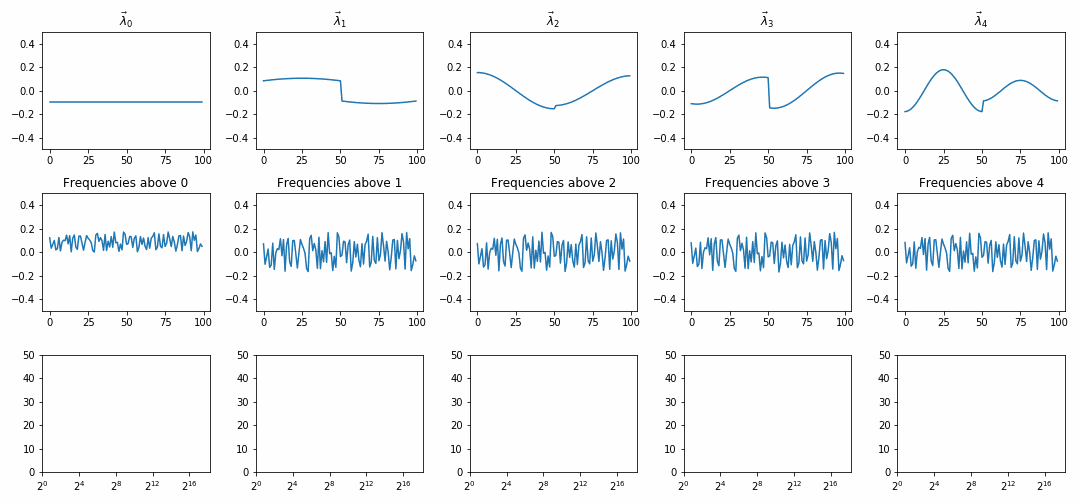
The domain is a circle graph with two equidistant low-weight edges. In the first row, we show consecutive eigenvectors of the Graph Laplacian. In the second row, we show how diffusion of random initial conditions converges to eigenvectors of the Graph Laplacian. Different columns show the solution projected onto increasingly high eigenvectors (ie. "high frequencies"). The third row shows energy remaining after this projection.
You can see our work in some of the following Jupyter notebooks:
We explored how graph spectral clustering works.
- Cumulative Eigenvector Clustering: Graphs showing how eigenvectors help with picking out clusters and gives an example where GSC outperforms k-means.
- Random Walks Between Clusters: Simulation showing that a random walker on a graph with transition probabilities that proportional to the weight of an edge tends to stay within clusters and rarely jumps across clusters.
-
Since the graph Laplacian is intimately related to the Laplace operator, we decided to look at some partial differential equations that included the Laplace operator. The first equation we investigated was the heat equation.
- Inverse Laplacian and the Heat Kernel: Connecting the Green's function of the heat equation with the gaussian similarity metric (solution to the heat equation) we choose to use in the Laplacian matrix.
- Evolving Eigenvectors under the Heat Equation: Shows how the heat equation picks out the eigenvector corresponding to the smallest eigenvalue.
- Clustering and Image Blurs: Shows how heat diffusion relates to clustering sections of an image, in particular differentiating the foreground and background.
The next PDE we investigated was the wave equation.
- Hearing the Clusters of a Graph: Shows how evolving a graph with random initial conditions according to the wave equation could allow us to recover eigenvectors.
-
We also applied this algorithm on some real world datasets.
- Mushroom_Clustering: Applied graph spectral clustering on a categorical dataset.
- GSC for Codenames Applied graph spectral clustering to a word vector embedding to use for popular board game Codenames.